|
The first tab in the Back Office is a dashboard showing loads of information regarding the current session sales activities. This is broken down into various lists and graphs:
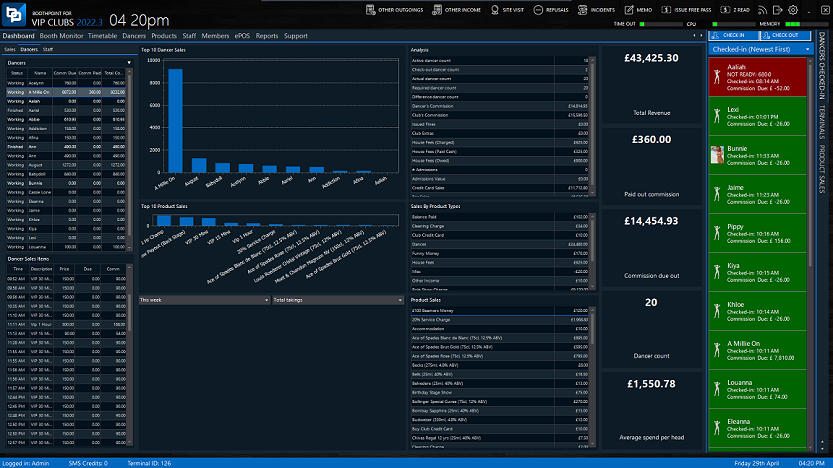
Left hand section
Middle section
- Top 10 Dancer Sales Graph
- Top 10 Product Sales
- Custom graph
-
This week, this month, this year, this week vs last week, this month vs last month, this year vs last year, last week, last month, last year, last 10 years
-
Total takings, club commission, dancer commission
Right hand section
- Analysis
- Sales by Product Type
- Product Sales
Information blocks
- Total Revenue
- Paid out commission
- Commission due out
- Dancer count
- Average spend per head
|